


Make your own Ohio scholarship map—and start finding relevant opportunities
Pro Tip
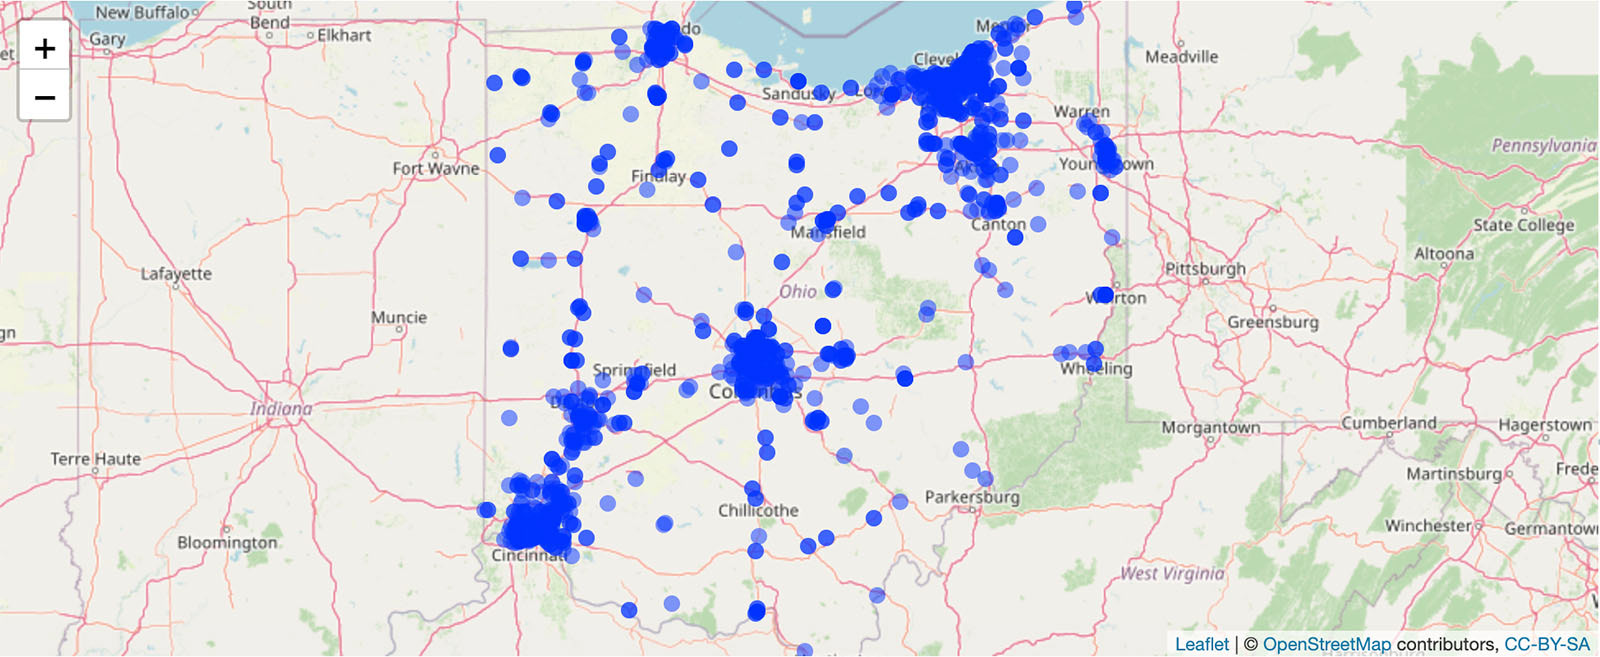
Your finished map will look like this. Move around and zoom in or out of the map to find what you're looking for. Click the circles for more information about the various scholarship providers. Have fun—and make your own!
How does this work?
• Download & Install: Use the provided links to get the apps and files you need to follow along.
• Do Some Coding: Learn some coding basics as you complete a quick and easy lesson.
• Make Your Map: Create your very own map of relevant scholarship opportunities throughout Ohio.
What's R and what's it good for?
R is a programming language for statistical computing. Whoa, hold on. That sounds pretty complicated. But like many tools, you can dive deep or skim the surface to get what you need. Plus, it’s free, so there’s no harm in trying it out. Here are just a few things you can do with R.
• Analyze data
• Compare & contrast data
• Sort & filter data
• Manipulate & transform data
• Visualize data
• Map data
• Use data to understand preferences
• Use data to make predictions
• Use data to track trends
Let's get started!

Download & install R
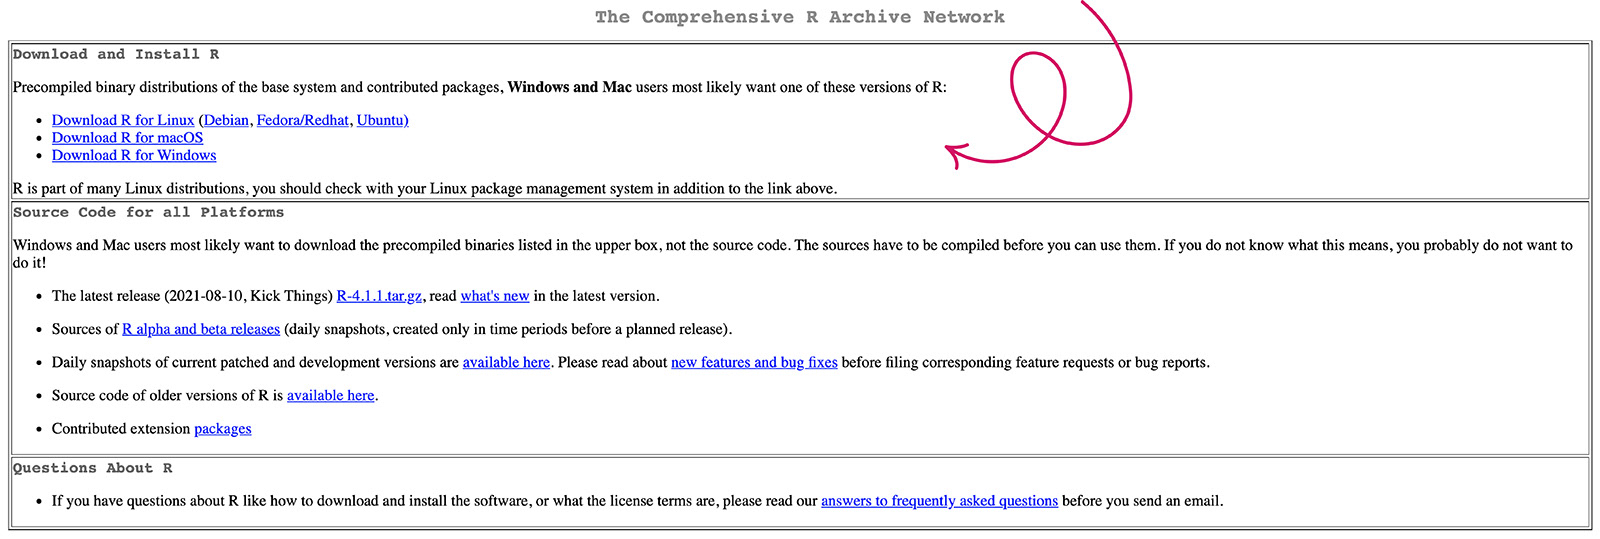
Let's begin by downloading R—a free programming language. This download creates the files needed to run R. Tap this button and follow the instructions for your system. No need to change any settings in the downloader.
Download & install RStudio
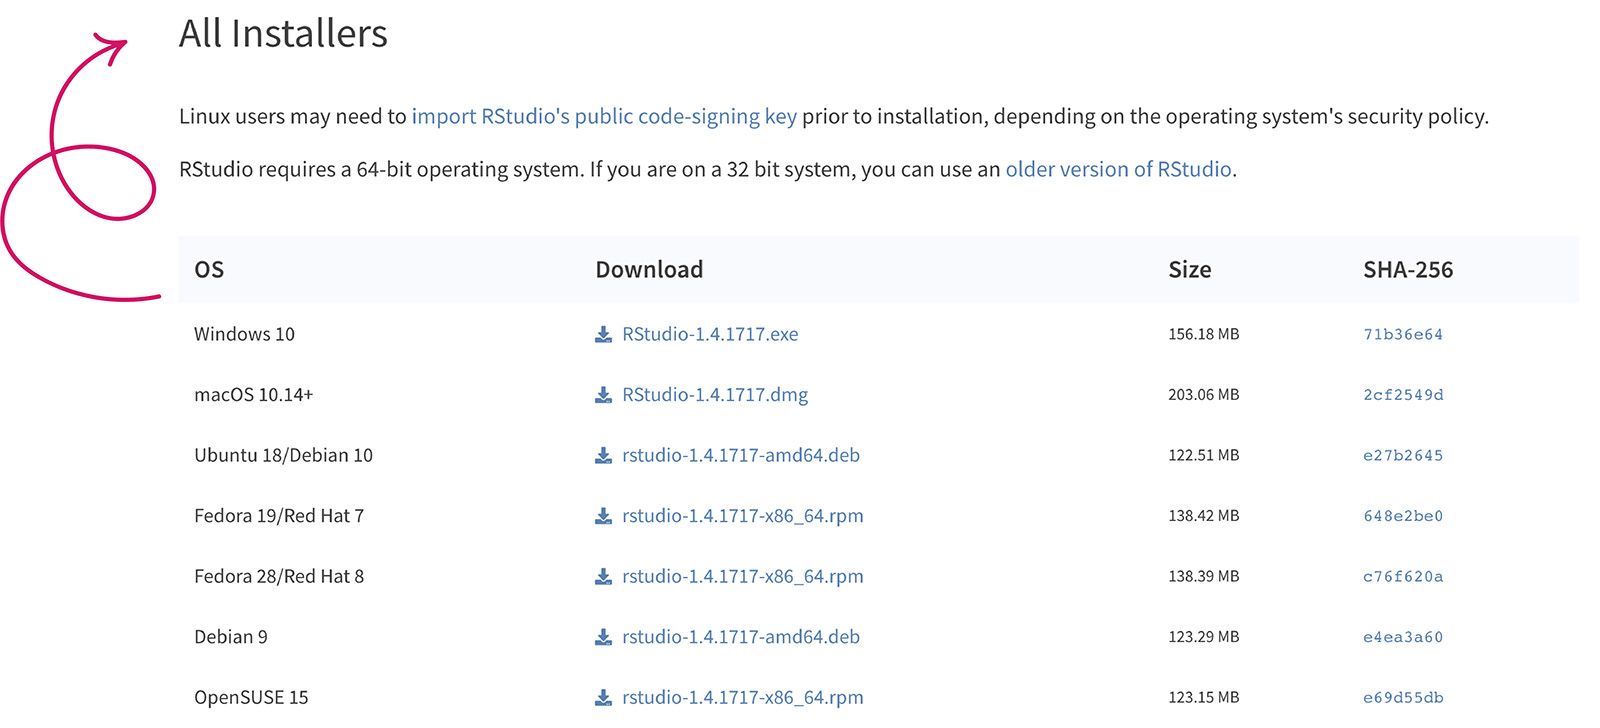
RStudio is a free interface that allows you to write R scripts. Now that you've downloaded and installed R, tap this button and download RStudio. Scroll down until you see the download links shown here and choose a file that works for your system. Follow all the prompts and leave the settings as they are.
Download the dataset
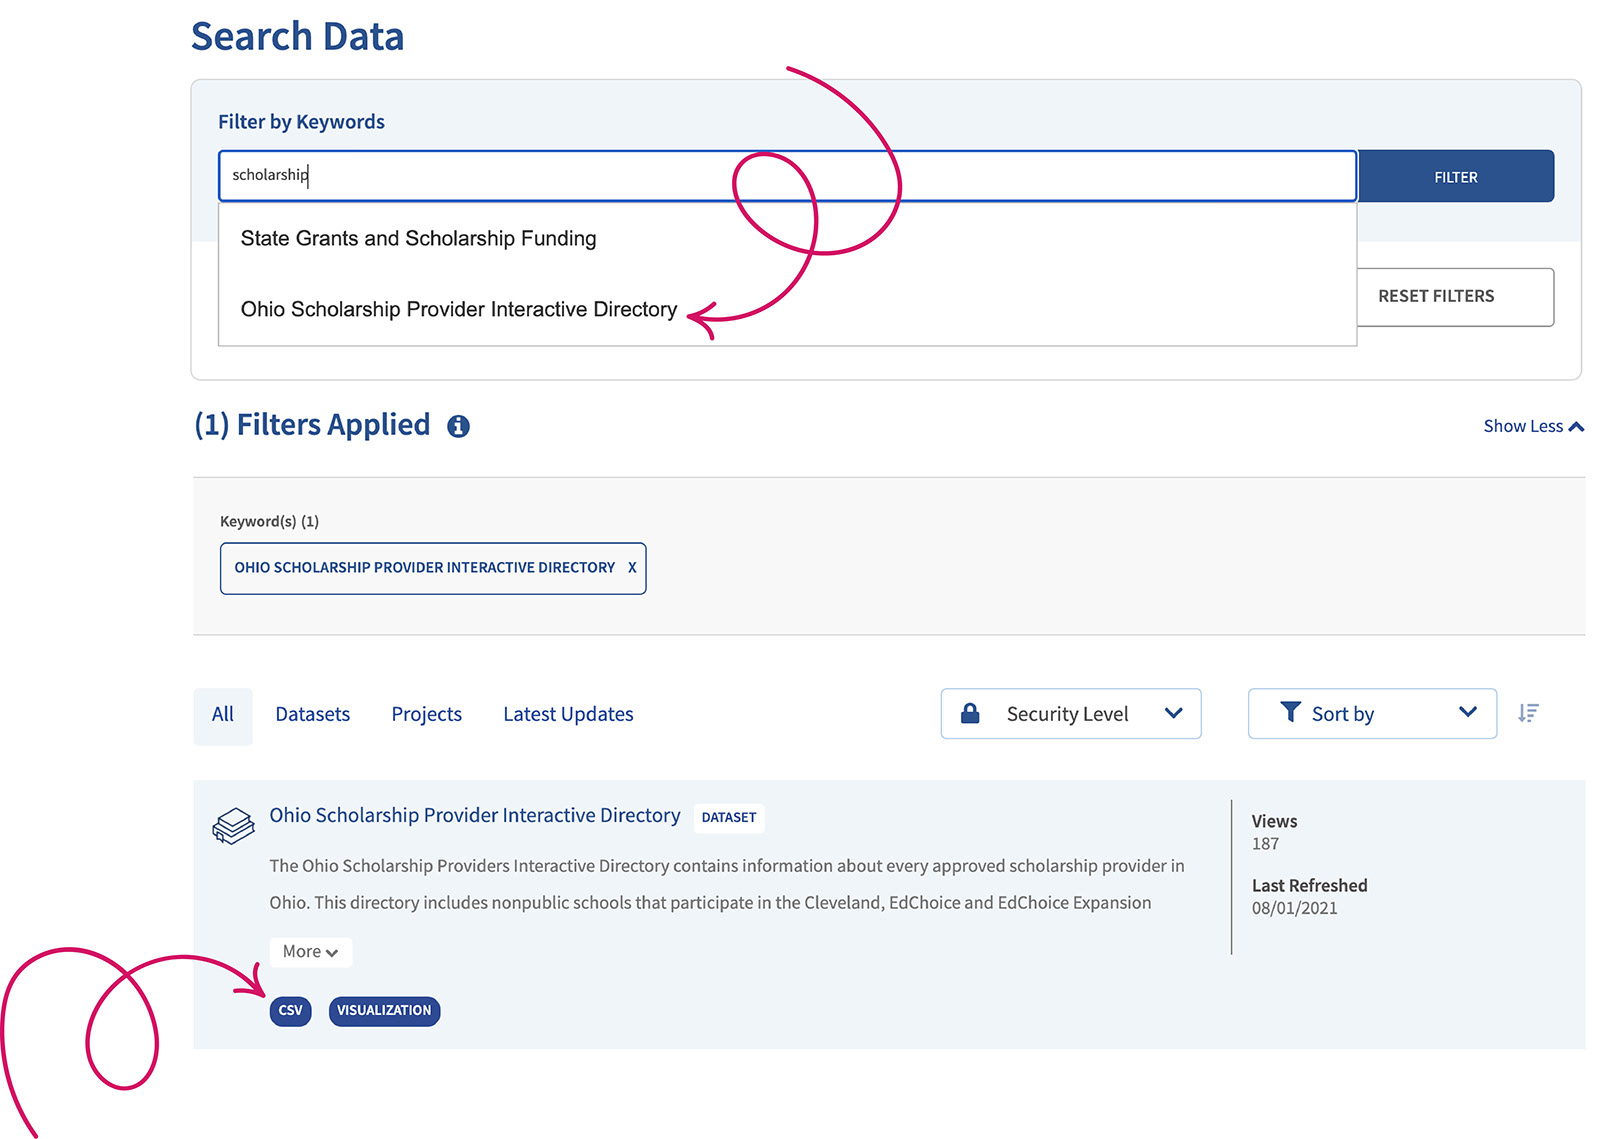
Now you're ready to download the data needed to build your map. This tutorial uses a dataset provided by our friends at DataOhio. Tap this button to go to the search screen shown here. Type "scholarship" in the search bar and click "Filter." Then select "Ohio Scholarship Provider Interactive Directory" to download and save a CSV file to the same location as your R downloads. Name the file "scholarship_providers.csv."
Pro Tip
Check out this handy reference for mapping data in R. The Leaflet section gives helpful advice on building and customizing your map to make it your very own.
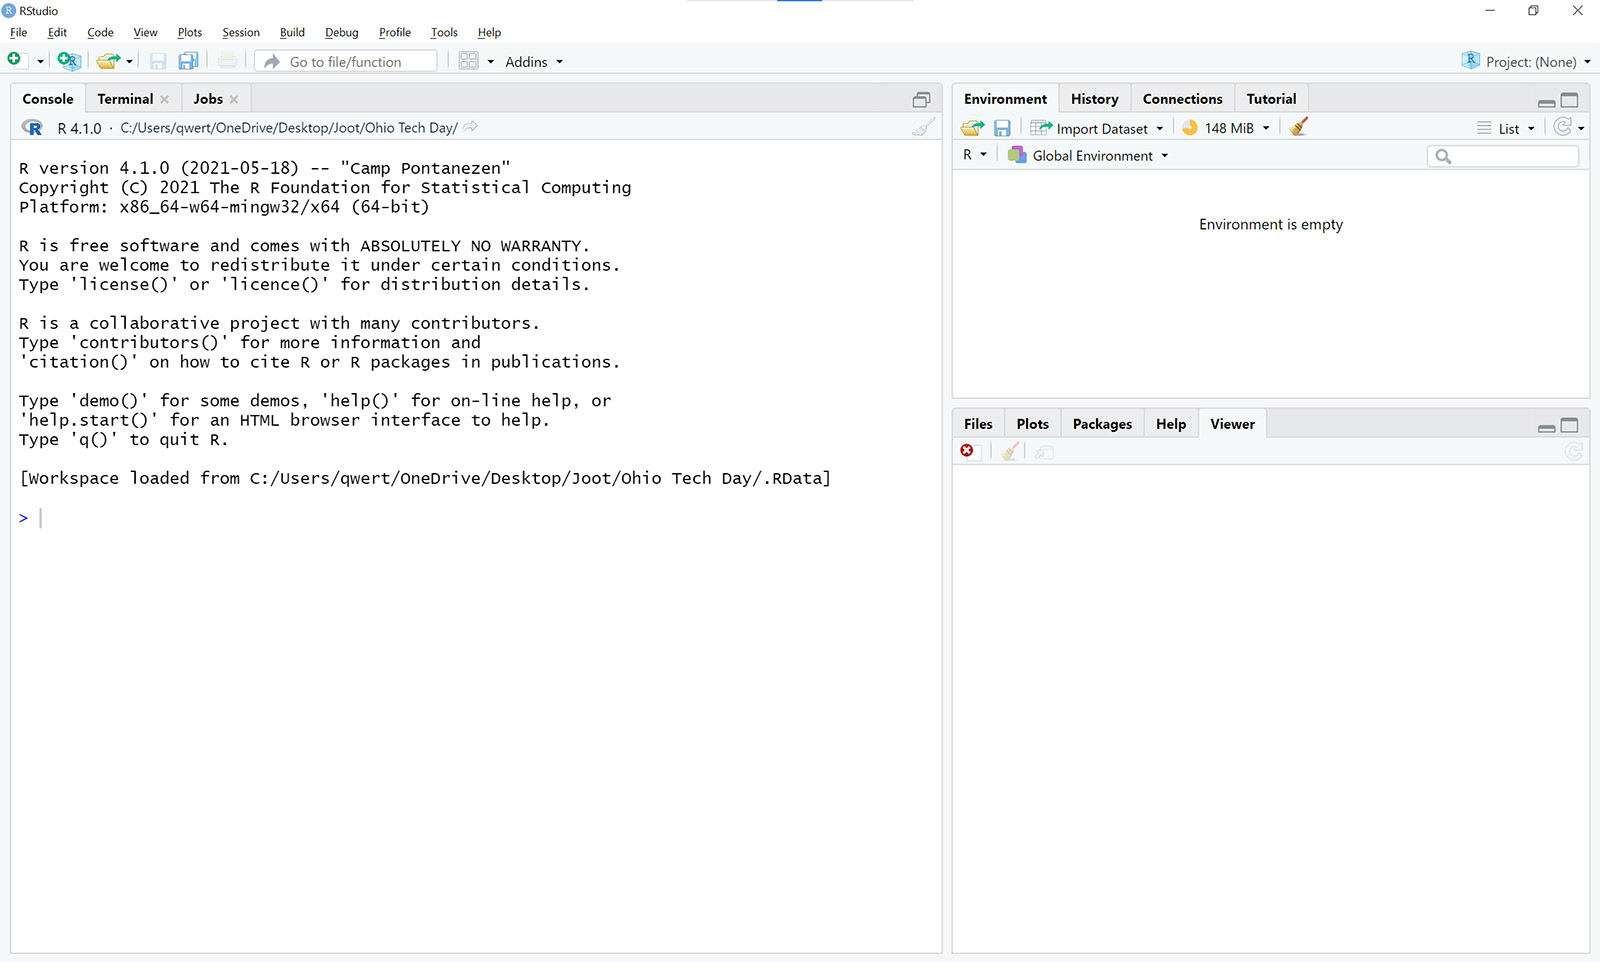
Open RStudio
Go ahead and open the RStudio app you downloaded earlier. Here's the intro screen of the interface.
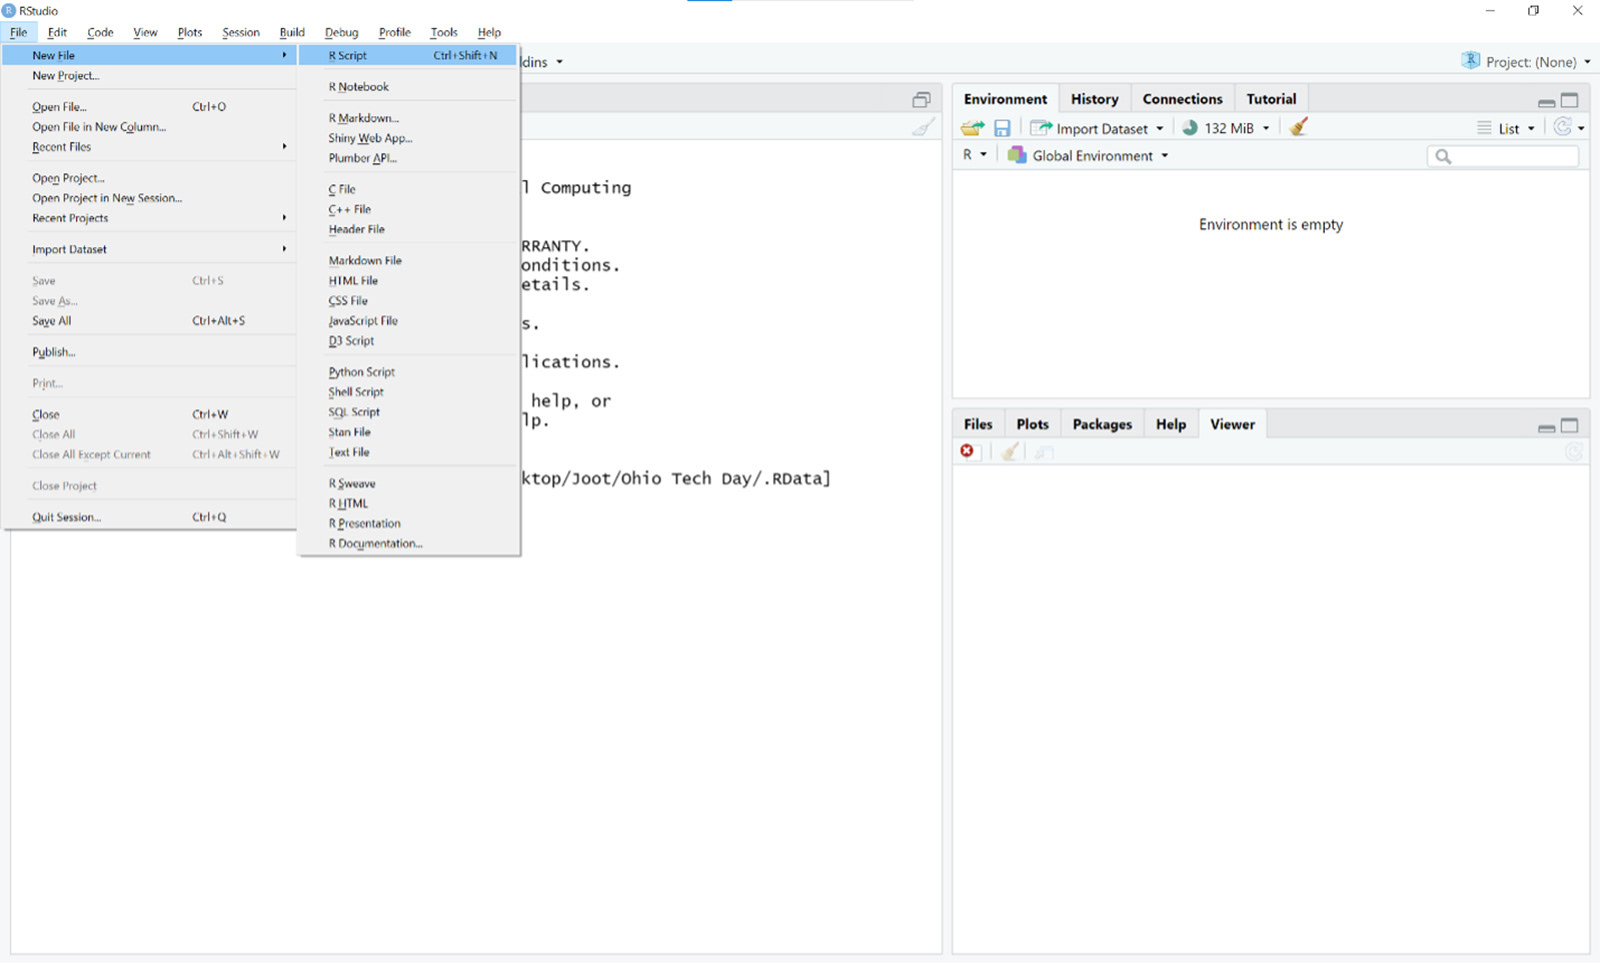
Create an R script
After the interface loads, you're ready to create a new R script for your code. Go to File → New File → R Script, as shown here.
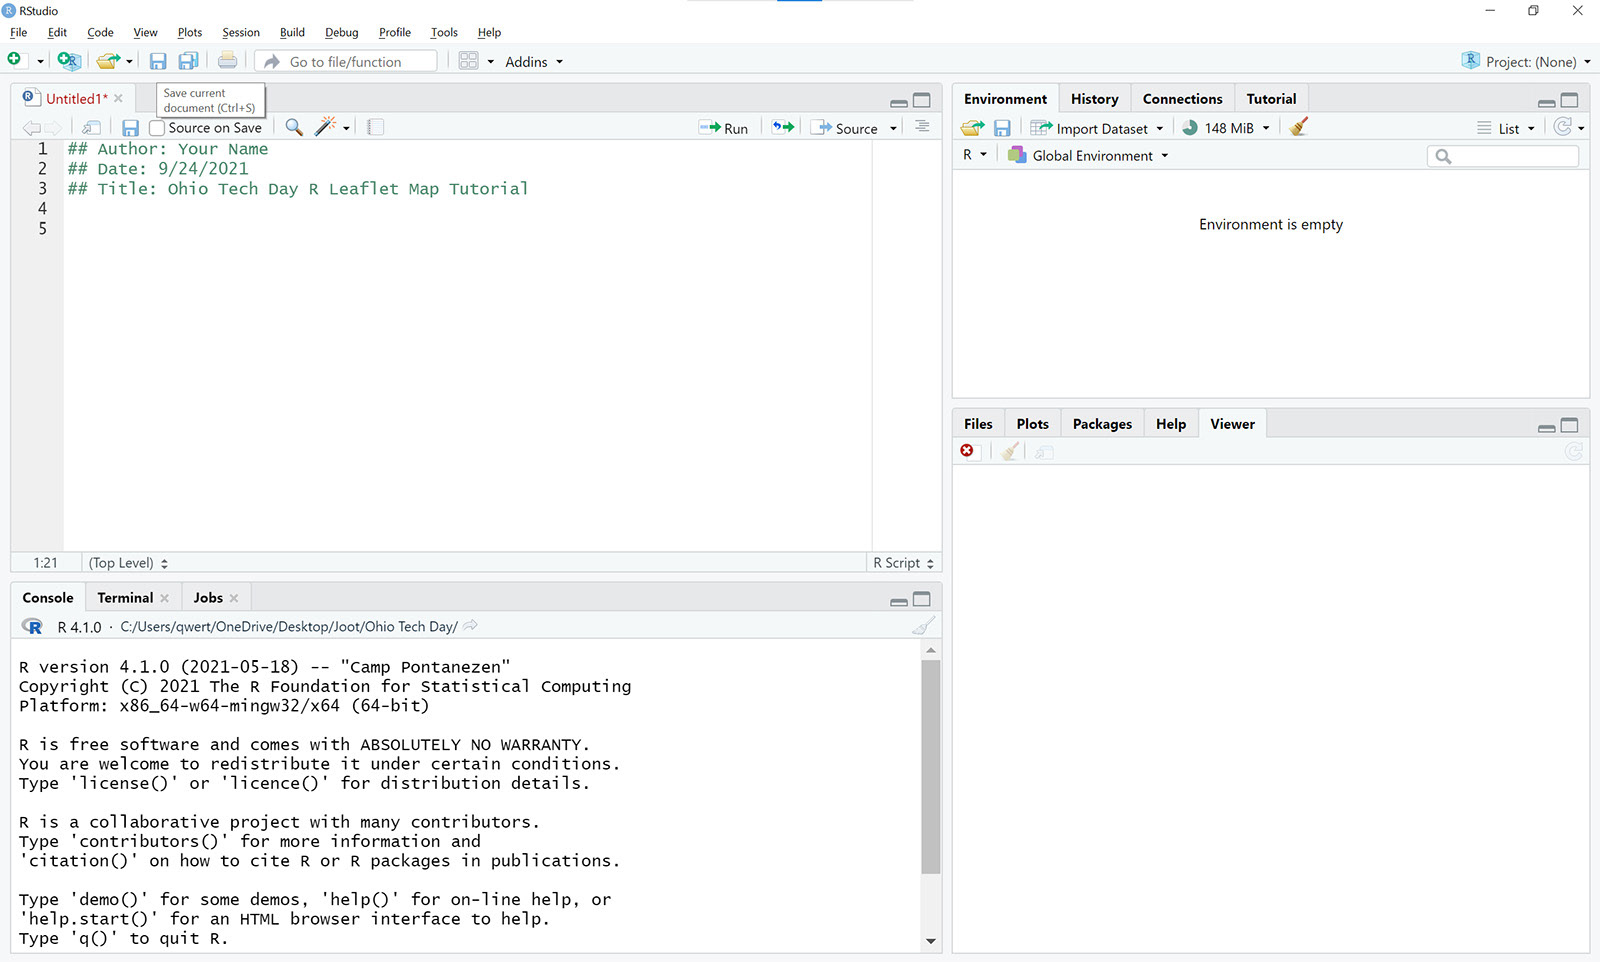
Add basic info to your script
An untitled window will appear next. Here, you can add the script's author (your name), date, and title. Be sure to use two hash symbols (##) before each entry to indicate these are comments and not code.
Pro Tip
Clearly commenting your code is considered good coding etiquette. Remember: you're part of a coding community! Pay it forward and help others follow along. And be sure to give credit to any sources you consult when writing code.
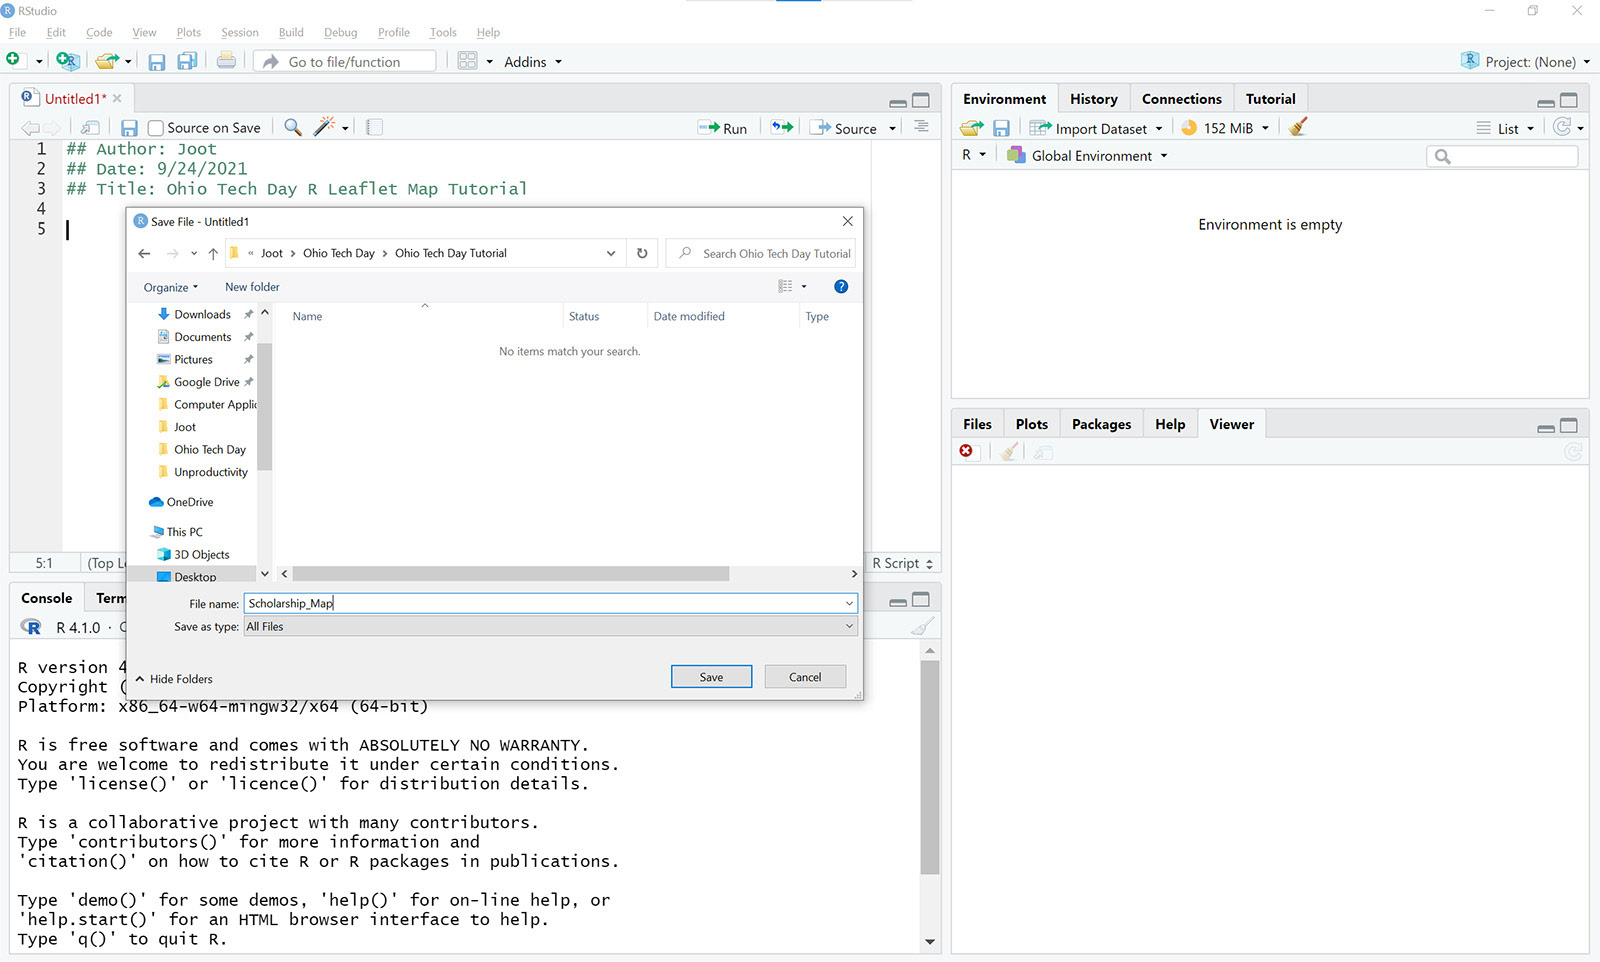
Save your script
Now is a good time to save your script. Click the floppy disc icon—the save icon—and select the same location where you saved your scholarship data. Name your script (we chose "Scholarship_Map.r") and click "Save."
Define your working directory
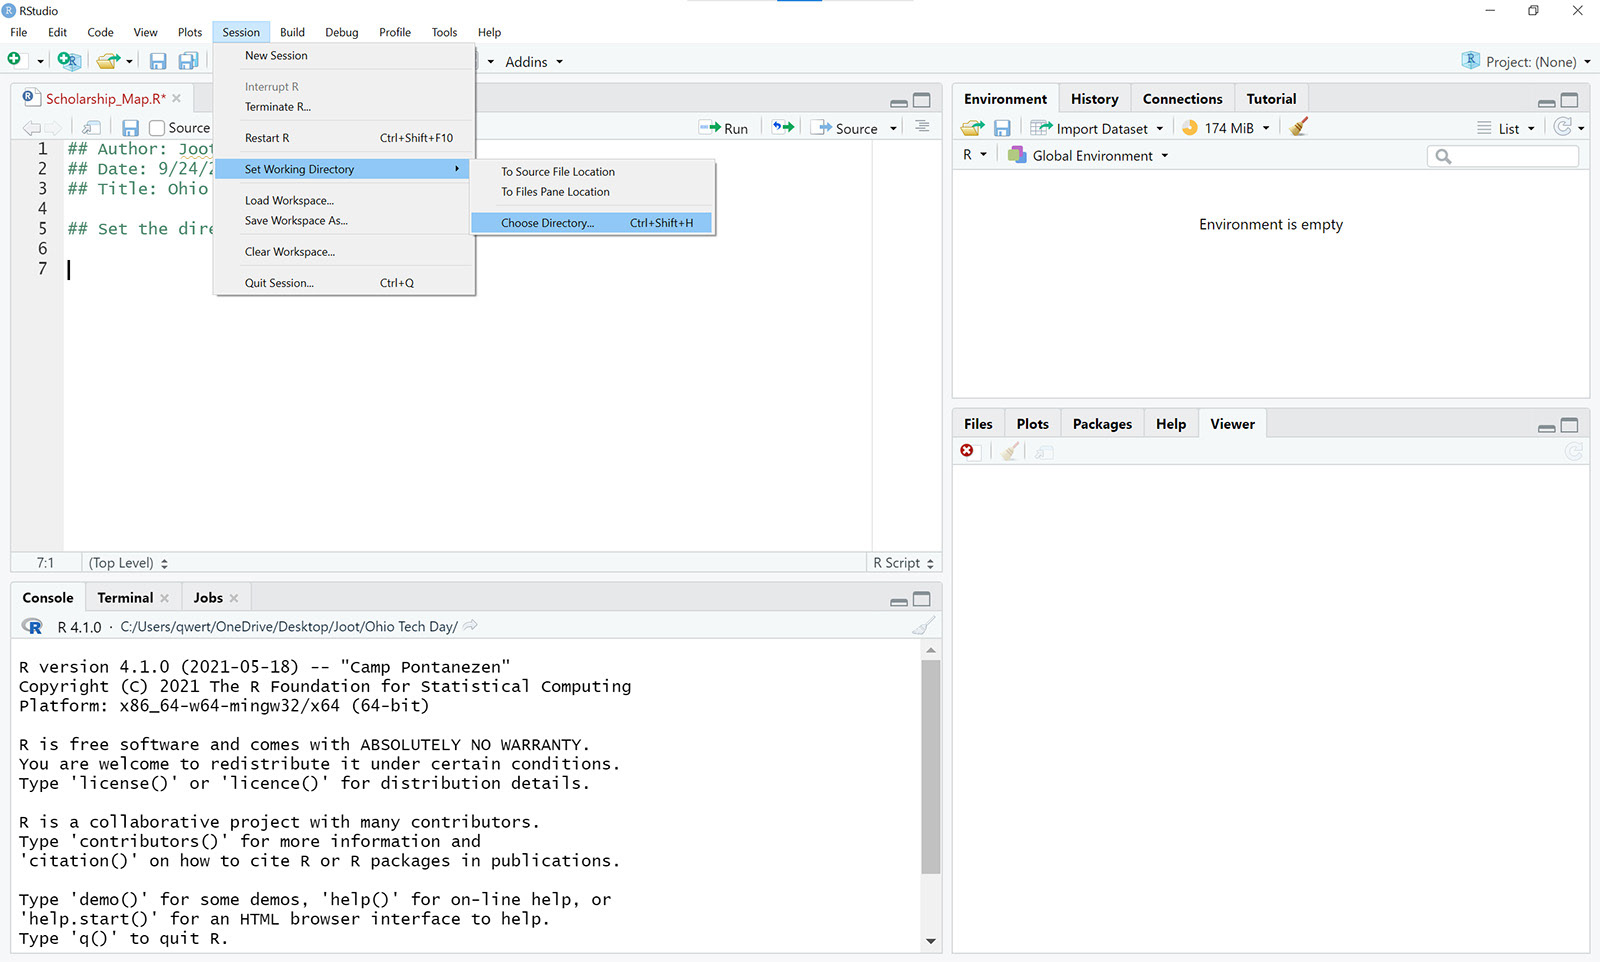
Next up: define your working directory, where the map program will save and load its data. Go to Session → Set Working Directory → Choose Directory and select the folder that contains the scholarship CSV file you downloaded earlier.
Install your directories
Once you define your working directory, a line of code appears in the Console window, as shown here. Copy and paste that code into your R script so it will run automatically in the future.
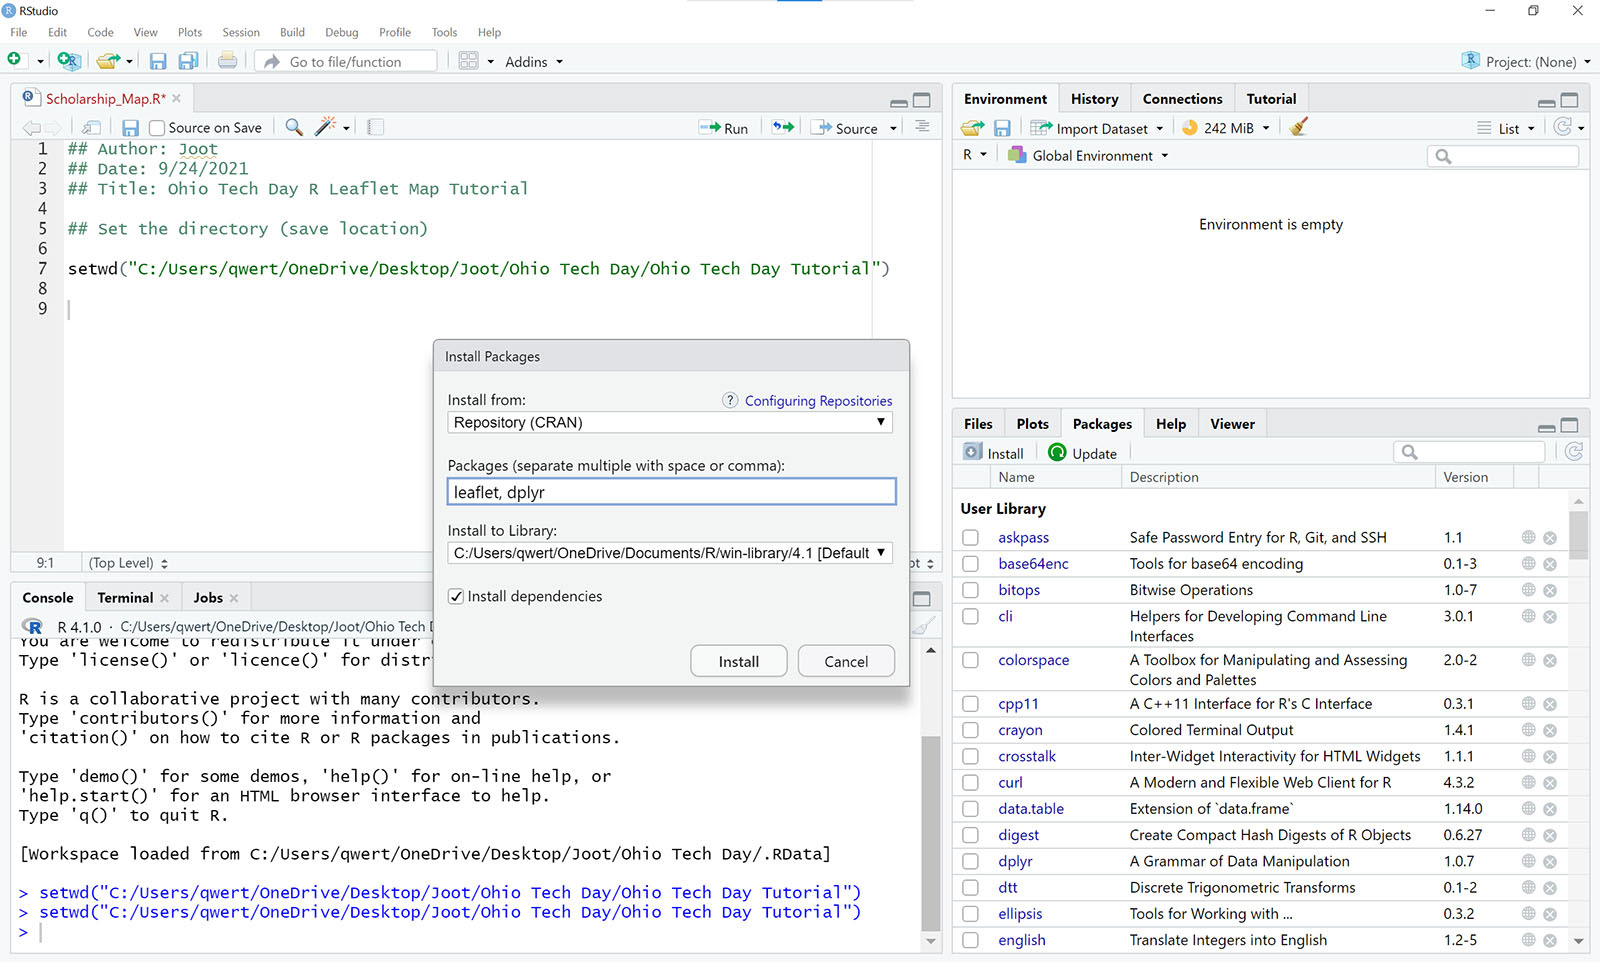
Now you're ready to install your directories. Two packages are required to run the map program: dplyr (for data manipulation) and Leaflet (for building the map). These packages save lots of time and effort otherwise required to write code from scratch. Go to the Packages tab in the bottom right quadrant and tap the Install button. Then type "leaflet, dplyr" into the Packages field and click "Install."
Now you're ready to install your directories. Two packages are required to run the map program: dplyr (for data manipulation) and Leaflet (for building the map). These packages save lots of time and effort otherwise required to write code from scratch. Go to the Packages tab in the bottom right quadrant and tap the Install button. Then type "leaflet, dplyr" into the Packages field and click "Install."
Run your code
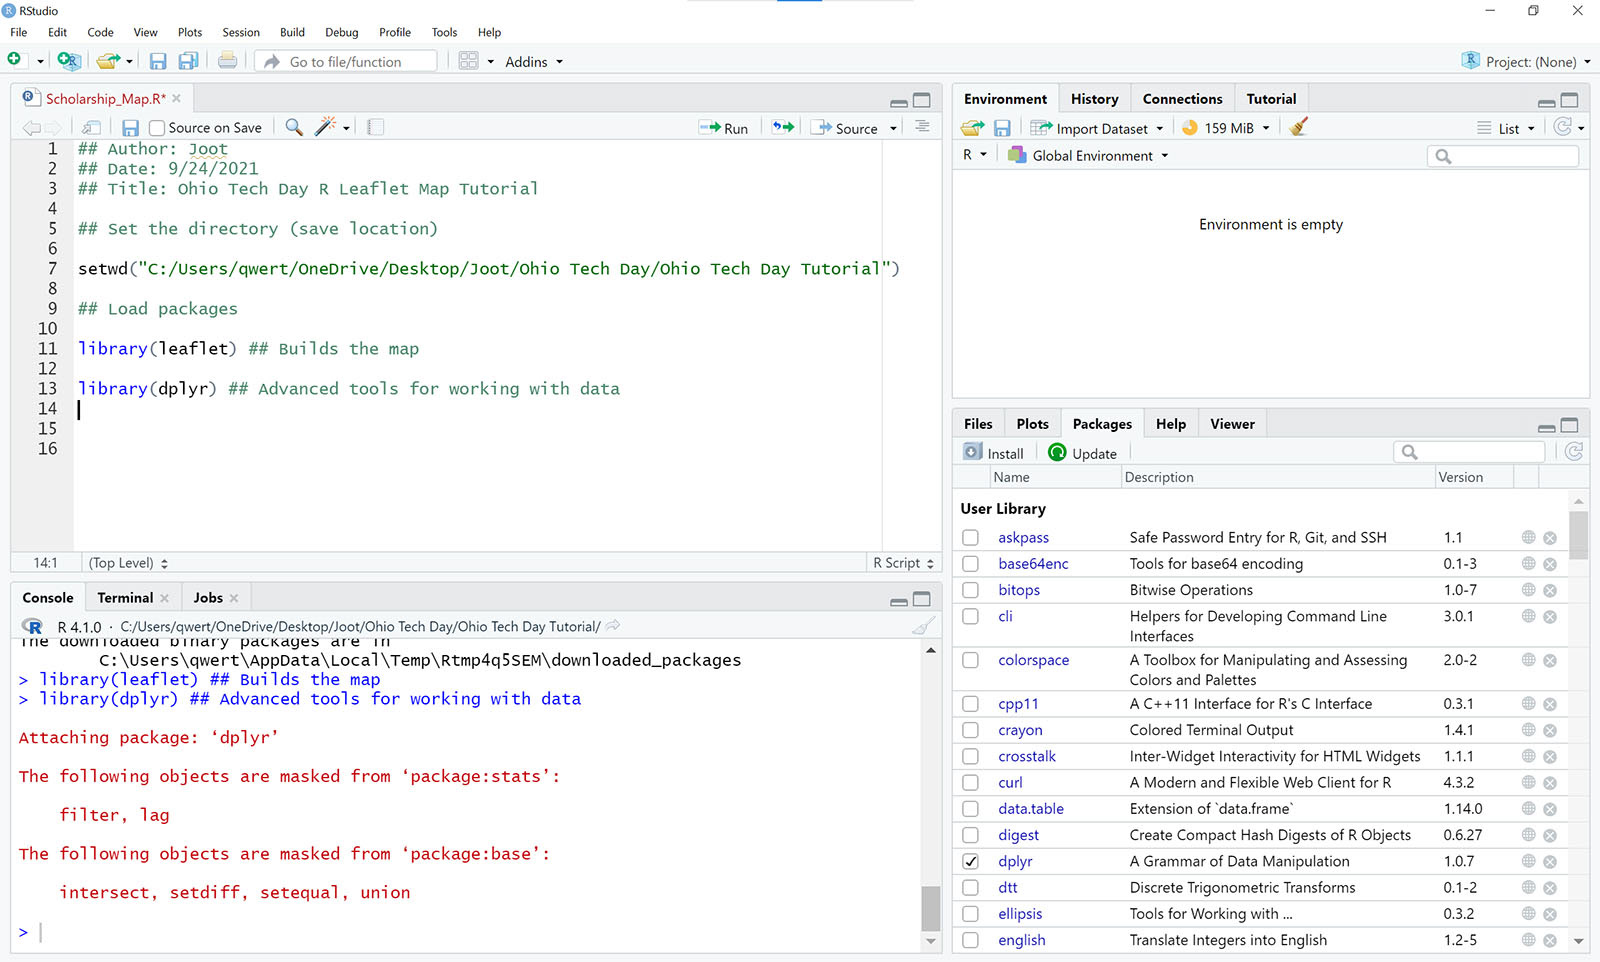
Before running your code, load the packages you just installed with the library function. Simply type "library(PackageName)" into your script, as shown here.
Now you're ready to roll! Make sure your cursor is above the code before you run it. R runs code linearly, from top to bottom, starting where your cursor is and moving down the script. After you position your cursor, tap the Run button at the top of the script window. Voilà!
Now you're ready to roll! Make sure your cursor is above the code before you run it. R runs code linearly, from top to bottom, starting where your cursor is and moving down the script. After you position your cursor, tap the Run button at the top of the script window. Voilà!
Pro Tip
It's good coding practice to pay attention to any alerts that appear in the Console window. Here, the alert about masked objects doesn't affect the map-making goal of this tutorial.
Load your data
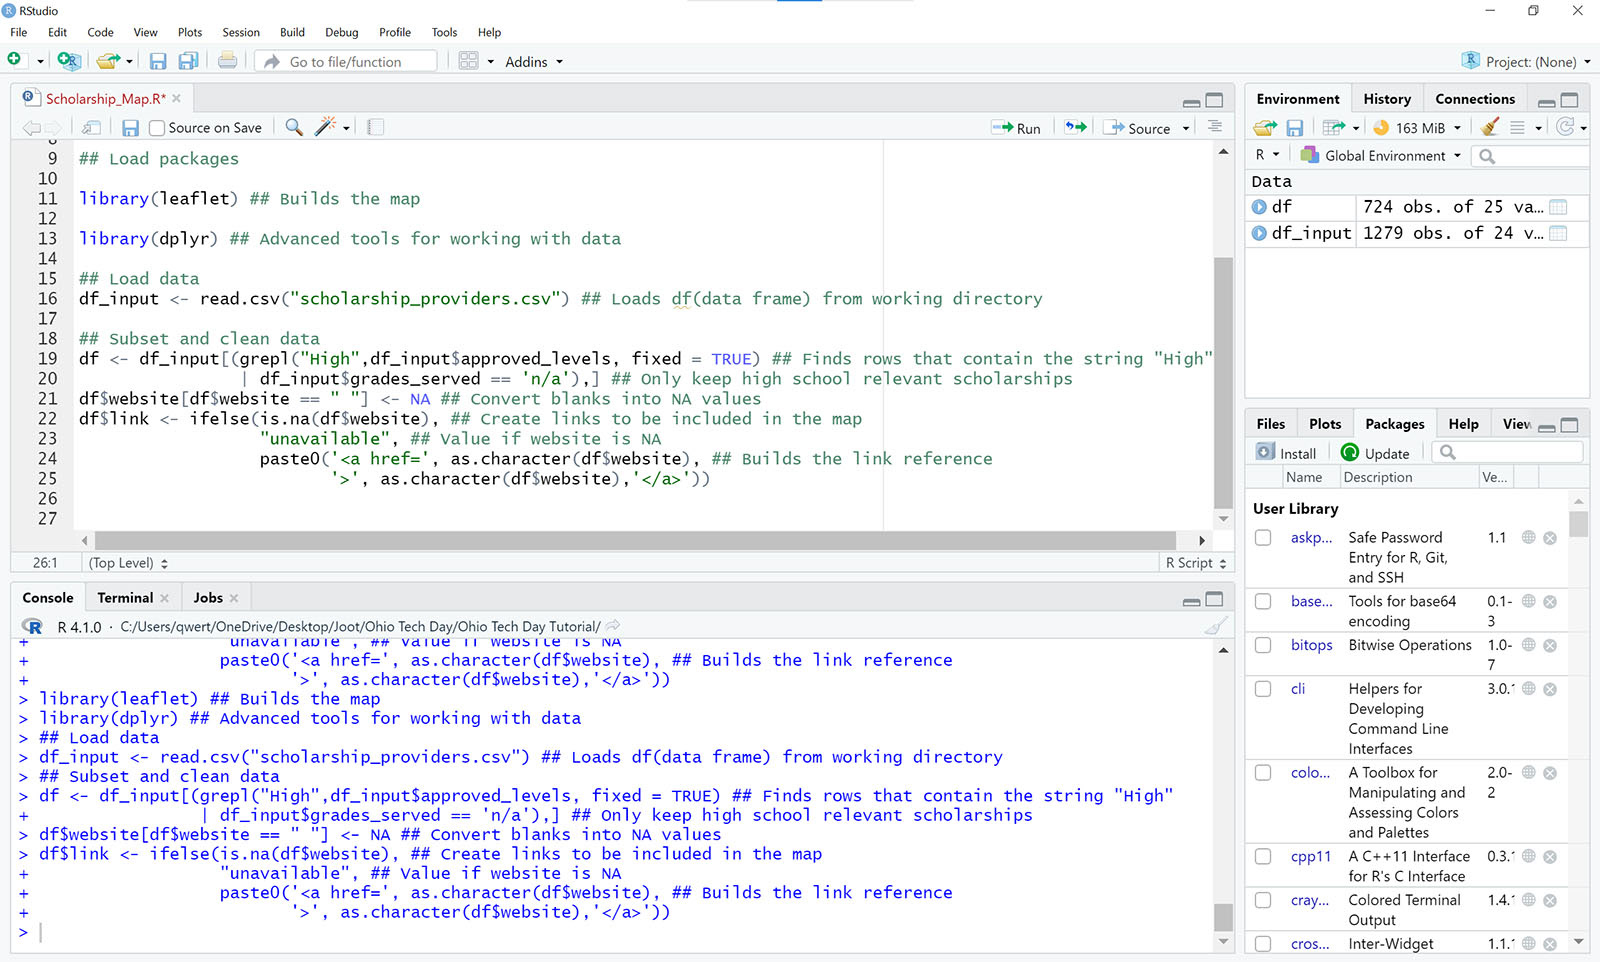
Here's where things get interesting. Let's load the data! Since you've already selected the working directory, all you need to do is call a "read.csv" command and enter the file name surrounded by quotes, as you see here. Then run the code to clean the data.
The data-cleaning code shown here does a couple things:
The data-cleaning code shown here does a couple things:
• It finds all the scholarships intended for high school students.
• It configures clickable links on the map.
Pro Tip
Check out this helpful overview of dplyr for more info on a range of dplyr commands.
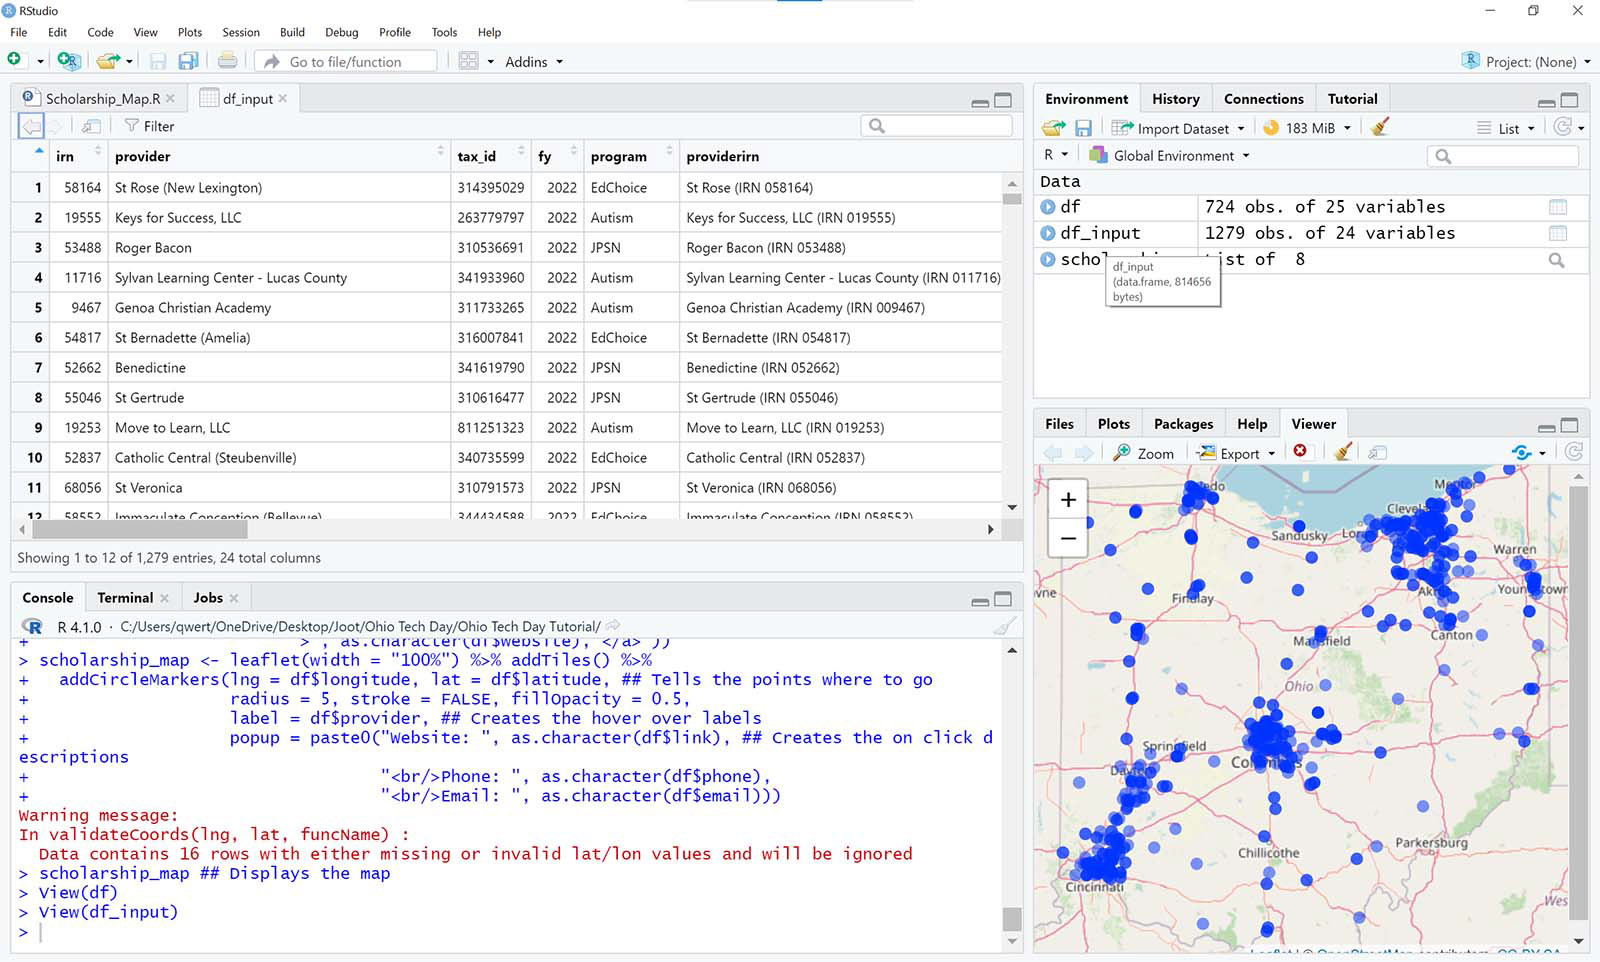
Check your data frame
Now check your data frame by clicking the play button on the right. Your "df_input" should resemble the one shown here.
Pro Tip
Notice any warnings that appear in the Console window. Here, any scholarship provider locations without associated geopositioning data are flagged as errors and will be ignored when the map is made.
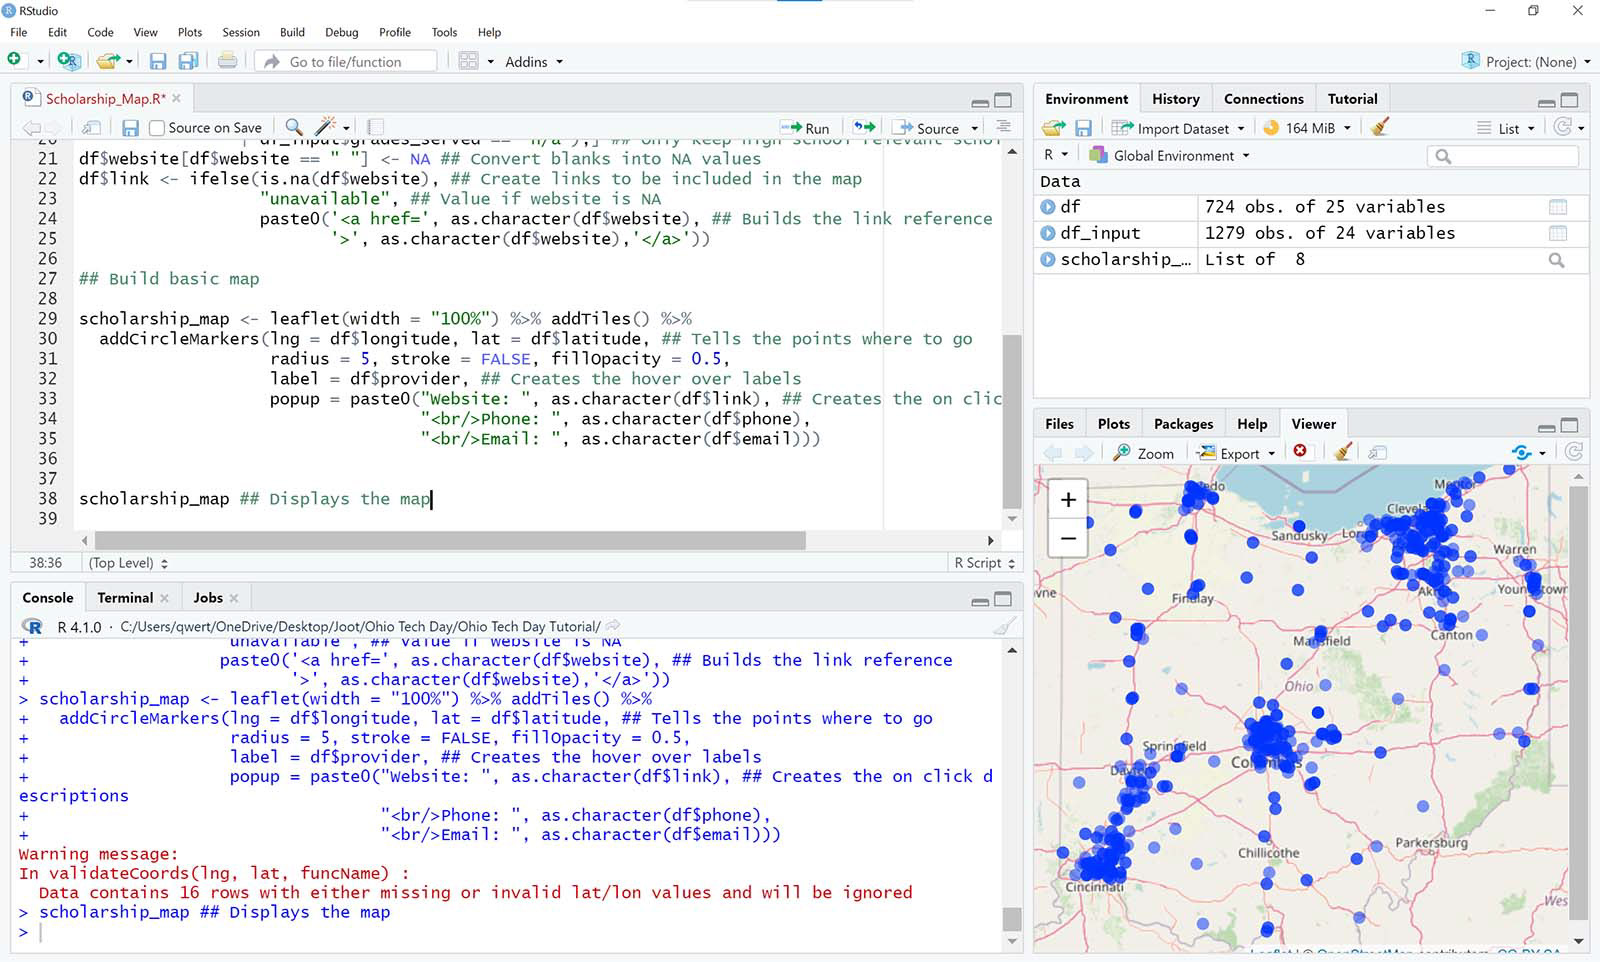
Make your map
Watch your map come to life in this last step. The "addCircleMarkers" function uses the latitude and longitude values in the dataset to place the markers on the map. The commands shown in the code displayed here give various values to the circles, making them user-friendly by adding names and other info about the scholarship providers. To explore all the details you can add to your map, tap the button below to discover more about Leaflet.
Finally, enter the name of your map and run it to display it in the sidebar viewer. Click "Export" to save your map as a web page and use the source code there to embed it in a website like this one.
Finally, enter the name of your map and run it to display it in the sidebar viewer. Click "Export" to save your map as a web page and use the source code there to embed it in a website like this one.
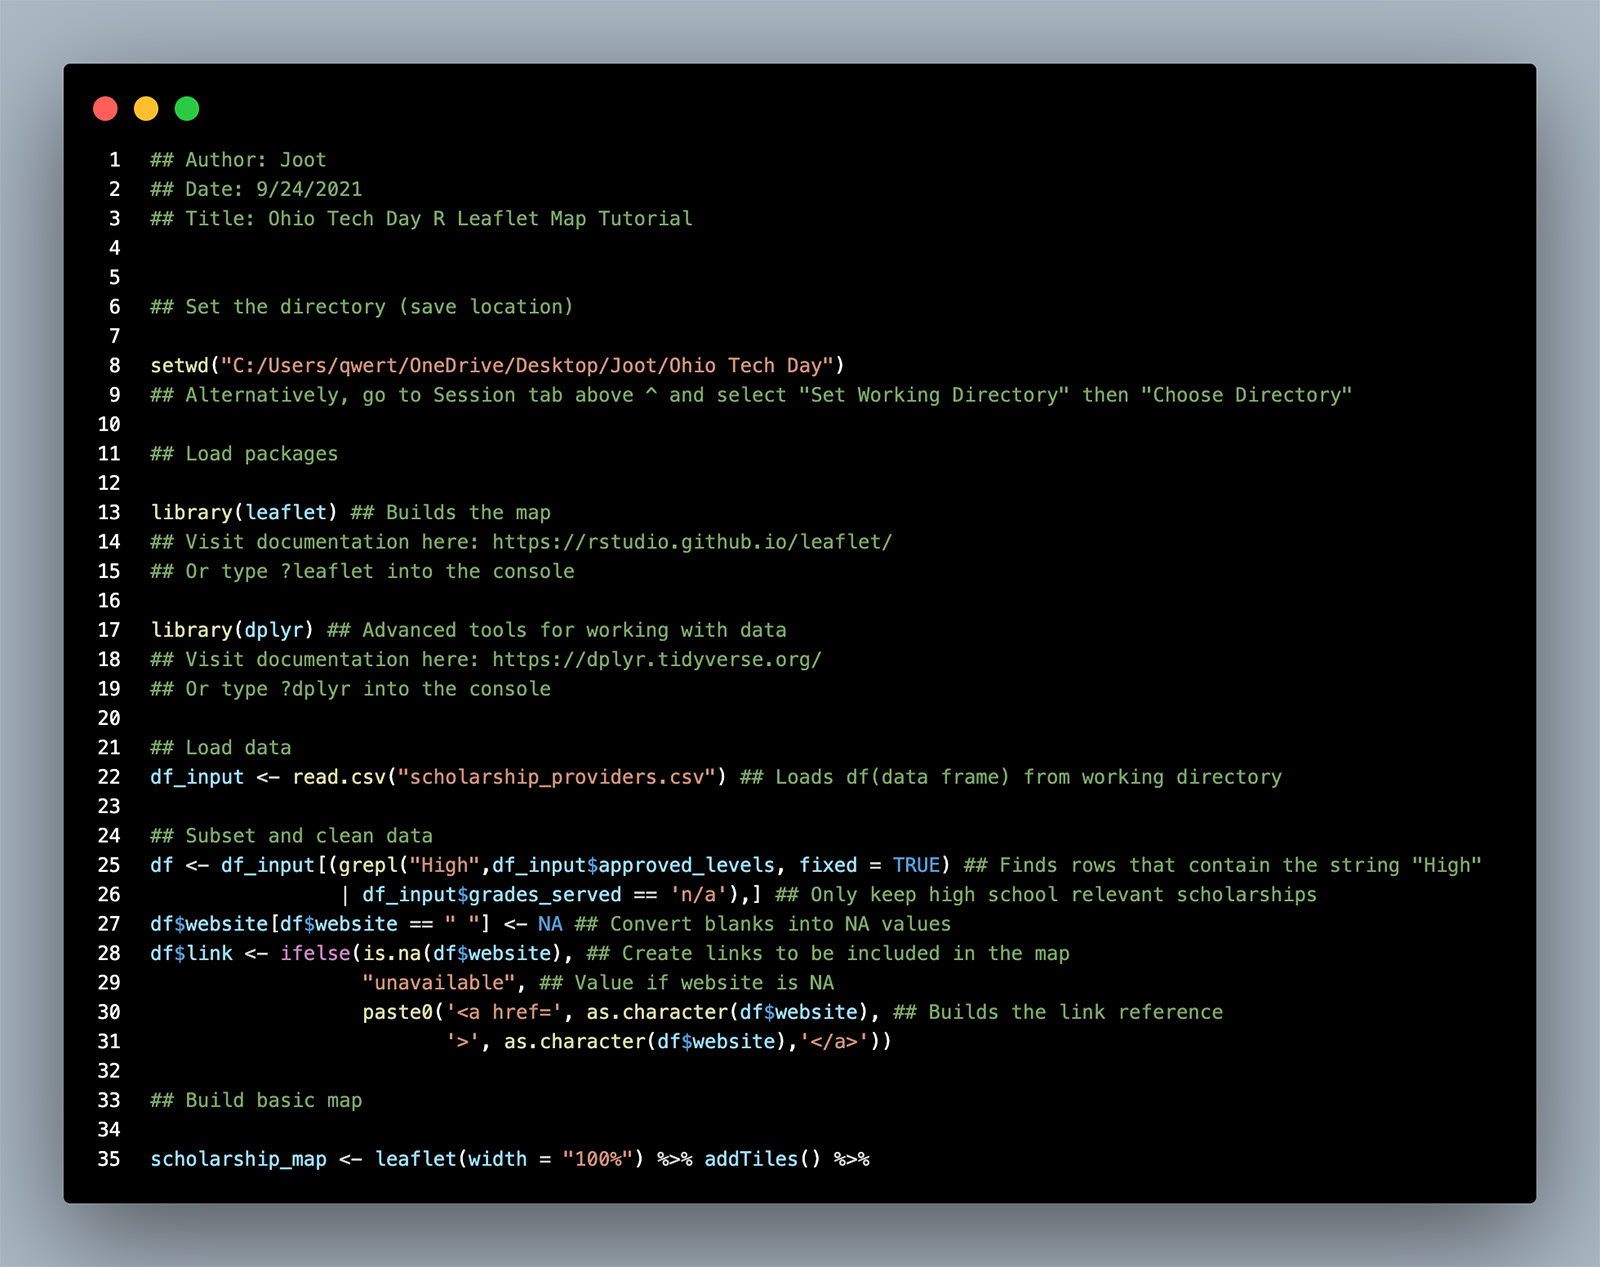
Done! Here's the code.
And there you have it! You've now created your very own scholarship map. Use it to find relevant opportunities and update it to get the information you need, when you need it. Have fun adapting this tutorial for your own projects.
Here's the code we used in this tutorial, for your reference.
Here's the code we used in this tutorial, for your reference.
Share your work!
Don't forget to share your map with your learning community! Use a free website builder like Google Sites to publish your map for the world to see. Tag us with hashtags #OhioTechDay and #JootForGood.
We can't wait to see your unique work. ♥
We can't wait to see your unique work. ♥
Who are we?

Karen Mauk, Director of Marketing @ Joot

Phillip DiSilvestri, Sales & Marketing Intern @ Joot
At Joot, we love data. Our technology and services are powered by data. And our marketing is data-driven too.
Our marketing team uses R to analyze data and—with the help of our engineering and services teams—turn those insights into product and service developments. We know that a little data can go a long way in improving people's experiences—and opening doors to new opportunities every day.
We'd love to hear how you use data and see all the amazing things you build with code. Please get in touch!

Adapted from © Karolina Grabowska